
Last month the government said that 8.1 percent of the American work force was unemployed, down from 9 percent in April 2011. Cue the golf clap.
Compared to an unemployment rate that was well above 10 percent in the early part of the Obama Administration, 8.1 percent sounds nice. But it is a moral victory at best. The reality is that the labor market stinks. Just ask college graduates. Or black guys over 19 years old. Or the New York Knicks.
So where is the disconnect between the headline statistics and the reality on the ground? The answer is an unfortunate circular problem.
What the Data Say
Let us start with some of the data. The unemployment rate headline number would actually be higher if it counted people who want a job, but have not looked for one in the past month because they are so discouraged by their prospects. Labor economists use the term labor force participation to refer to the total labor force (including people working and people looking for work) as a percent of the civilian noninstitutional population.
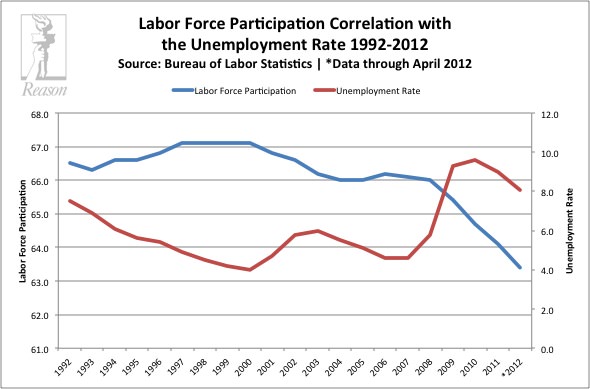
In April 2012, labor force participation was 63.4, the lowest rate since January 1981. This means that while unemployment has fallen from its high mark of 10 percent in October 2009, the percentage of Americans in the job market has also fallen from 64.9 percent that same month down to 63.4 percent 30 months later.
Over the last 20 years, the usual trend is for labor participation to expand as unemployment falls. This is because workers are being added to payrolls, and thus cutting down on unemployment. However, as you can see in this graph below, after the recession ended in the summer of 2009, both participation in the labor market and unemployment numbers have been falling. This suggests that the lower unemployment number is really just because so many people have stopped looking for work. Annoyingly, it doesn’t mean that the nation has increasing employment.
Of course, the White House would complain that there have in fact been new jobs created over the past few years. And that wouldn’t be wrong. Temporary employment from stimulus spending and more business confidence in the recorvery have keep the unemployment rate from being higher. But they have not been enough to make much of a dent in real unemployment.
So what should the unemployment rate be? It depends on how many uncounted workers really want jobs. To get an idea of what it could be, consider the following:
A year ago, the labor force participation rate was 64.2 percent. Still low relative to participation highs back in 2000, but nearly a full percentage point more workers contributing to the economy then the government says there are today. If we were to assume, however, that in fact the labor force was the same today as it was in April 2011 (not that much of a creative stretch), then the unemployment headline figure would have printed at 8.9 percent for the last month.
We could apply the same logic and estimate that if labor force participation were at the pre-recession April 2007 levels, then the unemployment rate would currently be 11.1 percent. And if you were to go all the way back to April 2000, when the labor force participation rate peaked at an all time high of 67.3, then unemployment rate for today would be 13.1 percent.
Lucky for the Obama presidential campaign, the labor force measurement is not as big as it was 12 years ago, and so the unemployment statistic reported in the news is 8.1 percent.
This is not the end of the story, however. If this labor force trend were the result of the recession then we could hope for an employment recovery in the near future. However, it turns out that the declining labor force participation rate is not a new phenomenon caused by the recession or financial crisis. As the above graph shows, the rate of individuals in the job market has been declining for over a decade. And that is where the circular problem kicks in.
The Value of Labor Growth
Labor force participation is important for economic growth because productivity is directly related to the number of people working in an economy. You can get productivity (increased economic output) from efficiency gains – i.e., bringing in robots to make goods in a factory faster then 100 people can. But usually, American economic output comes from innovation and new businesses that are staffed with living, breathing humans.
Different workers have different productive values, but it is a general rule that as a nation increases its labor pool, its economic growth expands. So part of the reason for the jobless faux-recovery has been the declining size of the American productive work force.
In research presented at the Brookings Papers on Economic Activity conference earlier this year, economists James Stock and Mark Watson looked at trends in GDP, employment, and productivity, and they found “most of the slow nature of the recovery in employment, and nearly all of the slow recovery in output, is due to a secular slowdown in trend labor force growth.”
Unfortunately, this is not a completely new phenomenon. Not only has the labor force been in decline since 1992 (as the chart above shows), but according to Stork and Watson the trend in annual employment growth has been falling since 1965! They also point to GDP trend data showing a decline in the rate of growth from 3.7 percent in 1965 to 2.5 percent in 2005. They argue that this is not just a correlated decline between GDP growth and labor force participation, but that that the latter is a partial cause of the former.
And thus the circular pattern is born: The decreased labor force participation negatively impacts economic growth. This in turn means fewer firms are hiring. The decreased employment opportunities mean less labor force participation. And round and round we go.
Blame the Women
Weak economic growth and discouraged workers are not the only hassle for the labor force participation rate. These factors understandably impact the short-term decline in workers, but not the long-term decline. After all, we did experience a nice economic boom from 1982 to 2007.
The answer to the long-term trend is shifting demographics. A huge part of the U.S. economic miracle in the early part of the 20th century was the surge in women being added to the work force. There was also a population boom following World War II that did wonders for economic production (though it now terrorizes the Social Security trust fund). Unfortunately, both female labor market participation and the population growth rate have been flatlining and declining over the past few decades.
According to the Bureau of Labor Statistics, the growth rate of the U.S. population has been cut in half since 1960, going from 1.64 percent to 0.85 percent in 2012. Female labor force participation peaked in the early 1990s at around 59 percent and then flatlined for two decades before taking a slight decline in 2011 to 57.7 percent today.
Stork and Watson argue that if women had been giving birth to more babies and at the same time working more, U.S. GDP could be as much as 1.2 percent higher today. That growth would certainly be an encouragement for firms to hire, in turn likely increasing the labor force participation rate.
Unfortunately, the trendlines are negative at this point, suggesting we are not going to break out of the cycle in the near-term. Stork and Watson write “These demographic changes imply continued low or even declining trend growth rates in employment, which in turn imply that future recessions will be deeper, and will have slower recoveries, than historically has been the case. In other words, jobless recoveries will be the norm.” The threat of a “new normal” is increasingly very real.
The New Normal
In trying to figure out whether we’ve reached a “new normal” it is helpful to consider a counter argument.
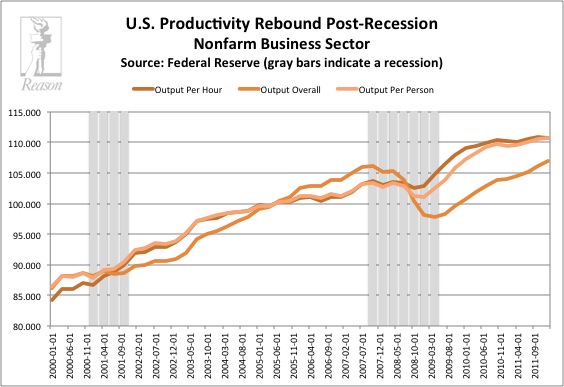
A quick look at productivity numbers shows that the economy has actually seen a rise in output since the end of the recession in 2009. The graph below shows that whether you measure output per hour of work, output per worker, or output in general, all metrics show an increase. But this is at the same time as falling labor force participation and stagnant GDP growth. So the weak economy is not because of the decline of the labor force cutting into productivity, but likely has more to do with soft demand (as Paul Krugman and Lawrence Summers would argue).
The problem with this argument is that it assumes we couldn’t be more productive then we are today. To drive the American economy out of this recession we need to be even more productive then the trend at present. Merely returning to roughly the same trendline seen before the recession is not enough for a real recovery.
We can see this more visibly by looking at the output gap, that is, the difference between what the American economy is capable of producing, and what we are producing. The following graph shows what the St. Louis Federal Reserve projects as the inflation adjusted potential capacity of GDP growth over the past few decades and what inflation adjusted GDP growth has actually been.
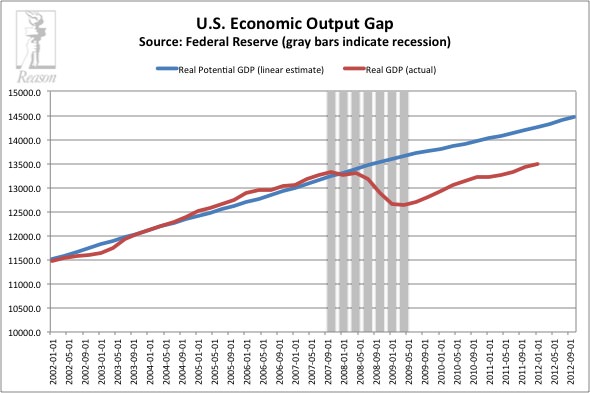
Economic growth and productivity are clearly not only dependent on labor force participation. Ideally, productivity is growing from expanded production of goods, growing consumption, and innovation. Recent productivity is being driven more by efficiency gains (output per hour of work has been increasing post-recession) than new products, which is part of the reason that the output gap remains.
The story of the recovery certainly gets more complicated when considering the host of non-labor factors influencing the economy – such as national debt, household debt, monetary policy, innovation, income stagnation, rising health care costs, etc. However, as Stock and Watson have pointed out, there is a very real impact on economic growth from a declining labor force.
Ironically, the growing productivity numbers actually help make the case that the labor market and economy could be setting into a “new normal” pattern. Consider that growing productivity despite high unemployment does not create incentives for firms to hire. A circular problem then develops where the productivity from efficiency gains leads to weak hiring practices pushing labor force participation further down, which in turn leads to more output gains coming from efficiency rather than economic expansion.
This cycle can be broken, and perhaps it will in the coming years. However, the Congressional Budget Office suggested earlier this year that because the labor force decline is so “unusually large decline over so short a time,” it does not anticipate the situation will change for at least another five years.
Anthony Randazzo (anthony.randazzo@reason.org) is director of economic research for Reason Foundation. This column first appeared at Reason.com on May 10, 2012.